2026-11-13 · 24 min · slam · robotics · computer-vision · 3d · benchmarks · bim
A 4:53 narrated explainer, drawn in code. Every number and picture in it is this article's own; the sources are below.
› transcript
A photo, taken on a dark December night in Oxford. Can a map built on an overcast day say exactly where the camera stood? Hi, I'm Halvard! Today: how a visual positioning system finds a camera from a single picture, and how to read a demo of one. Chapter one. A map that remembers. Start with one overcast November drive. In every image, find key points, and describe the patch around each as a vector. Match those features between overlapping images, then triangulate each match into a point in space. Bundle adjustment refines every camera and every point together. Out comes a cloud of 3D points, each keeping the descriptors it was seen with. That memory lets a new photo find it again. This is the benchmark's map of an Oxford square, built from the reference drive. And these are query photos of the same building: sun, night, snow, and low sun that washes everything out. Chapter two. One photo, one pose. First, retrieval. One vector for the whole photo, compared with every map image, returns the few most alike. A city shrinks to a street. Then local matching. Each query feature that matches a feature of a mapped point becomes a correspondence: this pixel shows that point. Finally, Perspective-n-Point solves for the rotation and position that project those points onto their pixels. Three good correspondences are enough. Seen from above, the map is two rows of facade points along the street. A query photo's matches are rays from the camera. Most end on the point they claim. Some are wrong, and point at nothing. RANSAC draws three rays at random, solves a pose, and counts how many other rays that pose explains. The pose with the most support wins. At night most rays are wrong. A triple with a bad ray can win the vote, and the pose lands somewhere else entirely. Learned features bring enough good rays back. The vote finds the true pose again, and the inliers light up. This is why conditions matter: they set the share of good matches. If a share w of the matches is right, a random triple is clean with probability w cubed. N is how many triples you must draw to see one clean triple. At seventy percent good, about eleven. At ten percent, over four thousand. Chapter three. What night does to a feature. In the benchmark paper, a standard hand-crafted method placed about half of rain queries within twenty-five centimetres. At night, half a percent. With learned features, night queries can succeed. Here, a dark query and its daytime map image share many consistent matches. But there are two ways to fail. Retrieval can return the wrong place, or the right place can yield too few good matches for the vote. Today the public board's night column runs from about forty percent for the standard single-camera pipeline to sixty-six for the best row. Chapter four. What MultiSet's video shows. MultiSet built its map from the overcast day, then localised photos from nine other drives across a year. Here is the dry night drive of December the tenth. Each card prints the error from the reference pose. These three night queries land eighteen to twenty-four centimetres off. All twenty-seven showcased queries fall inside the finest threshold. Those are good results for those photos. But they were chosen for a video. At the best row's rates, twenty-seven random queries would all pass about once in twenty-seven thousand tries. So here is what is missing. There is no recall, the share of all queries that pass. No row on the public board connects to MultiSet. The cards need reference poses, so these are probably from the half whose poses are public. And the reference poses carry their own error, about the size of the numbers on the cards. Chapter five. Photos that land where they were taken. At a trade show, plant and site people asked for two jobs: photos that land where they were taken, and finding the equipment they were sent to fix. On a site, the hard cases are repeated floors and a scene that changes every week. RobotCar tests neither, so measure on your own held-out photos. A VPS is retrieval, matching and a RANSAC vote. A benchmark's value is its denominator; the video left it out. The map remembers, RANSAC votes, and a demo shows successes, not a rate. Thanks for watching! Every source is in the full article. I'm Halvard. Bye!
Why read this
Solidtop 85%How a VPS localises one photo, from SfM map to PnP+RANSAC, then a frame-by-frame read of MultiSet's RobotCar video against the public leaderboard.
- Original analysis
- A lasting reference
- Concrete numbers to act on
3D & spatialAPI onlyProprietaryPractitioner teardown
How this was scored
- Is it new?
- 1 of 3: An incremental tweak
- Can I trust it?
- 2 of 3: Measures key facts from files, code or configs
- Can I run it?
- 1 of 3: API-only, gated or restrictive licence
- Will I understand it?
- 2 of 3: Mechanism from first principles with figures
- Can I act on it?
- 2 of 3: A concrete recipe, numbers or comparison
- Will it last?
- 2 of 3: A reference for a year or more
- Does it affect many?
- 1 of 3: A specialist community
- Only here?
- 2 of 3: A teardown or measurement few others did
Score 59 of 100, ranked 475 of 740 rated articles. Each question is answered 0–3 by hand, and a 3 is rare. How articles are scored
On 12 November Nikhil Sawlani posted a video of MultiSet's visual positioning system running on Oxford RobotCar Seasons. His framing: "Localization is the first problem in Physical AI. Navigation, delivery, inspection, manipulation." And the setup, in his words: "The map was built on one overcast day. Then we localized in nine different conditions, captured across about a year: dawn, dusk, night, night-rain, overcast summer, overcast winter, rain, snow and sun."
The video is good. A car-camera photo sits on the left. On the right, a camera frustum flies into a textured reconstruction of an Oxford street, a fan of purple rays lights up between the photo and the map, and a caption reads something like "Overcast, winter · 5 cm · 0.6° from the reference pose". Then the next photo. Twenty-seven of them, three per condition.
Thirty-three minutes earlier, MultiSet's Shadnam Khan posted from a trade show: "the question I got most from plant and site people was which job to prove first. Photos that land where they were taken, and finding the piece of equipment you've been sent to fix, came up again and again."
Both posts are about the same capability. Give the system one photo, get back where the camera was, in the coordinate frame of a map someone built earlier. I care about it for a specific reason: I turn 360 and fisheye walks of construction sites into metric scans and BIM. A photo a site engineer takes on a phone is only useful to that pipeline if it lands at the right spot in the model. So I wanted to know two things. How does a VPS do this from first principles, and what does the RobotCar video actually establish?
The short answer to the second: it shows the system works on 27 chosen photos. It does not say how often it works. The benchmark it uses was built to answer exactly that question, and MultiSet has not reported the answer.
GPS, SLAM and VPS answer different questions
GPS gives you a position in a global frame, with no orientation, and in a street of three-storey buildings or inside a plant it gives you that position to several metres on a good day. A photo pinned with phone GPS lands in the right block, not on the right valve.
SLAM gives you a pose relative to where the session started. It tracks well, but its frame is the session's own: switch the phone off and on, and the new session has a new origin. It also drifts with distance travelled, which is what the Hilti SLAM challenge grades against surveyed marks.
A visual positioning system answers a third question: given this image, where was the camera in the map's frame? The answer is absolute (position and orientation, six numbers), it does not drift because it is recomputed per photo, and it is in the same frame for every device that ever queries that map. MultiSet's visual localization page puts it this way: a phone today, a headset next week and a robot on the night shift get coordinates that agree. That is the property a photo-to-BIM workflow needs. A photo localised against a map that is registered to the model drops into the model.
The cost is that you need the map, and the map was built under some conditions. Every later query was taken under different ones.
The map is 3D points that remember what they looked like
The usual VPS map is a structure-from-motion (SfM) reconstruction. You take many overlapping images, detect local features in each (a keypoint location plus a descriptor vector that summarises the patch around it), match features between image pairs, and triangulate matched features into 3D points. Bundle adjustment then refines all camera poses and all points together by minimising reprojection error. What comes out is a sparse point cloud in which every 3D point keeps the descriptors of the image features it was triangulated from.
That last part is the point of the exercise. A 3D point with descriptors can be found again in a new photo by matching descriptors, and once you know which pixel shows which 3D point, the camera pose is a geometry problem.
RobotCar Seasons ships such a map. In the benchmark paper (Sattler et al., CVPR 2018), Table 2 lists the reference model at 20,862 images, 6.77M 3D points, triangulated from 36.15M features, all from the overcast traversal of 28 November 2014.
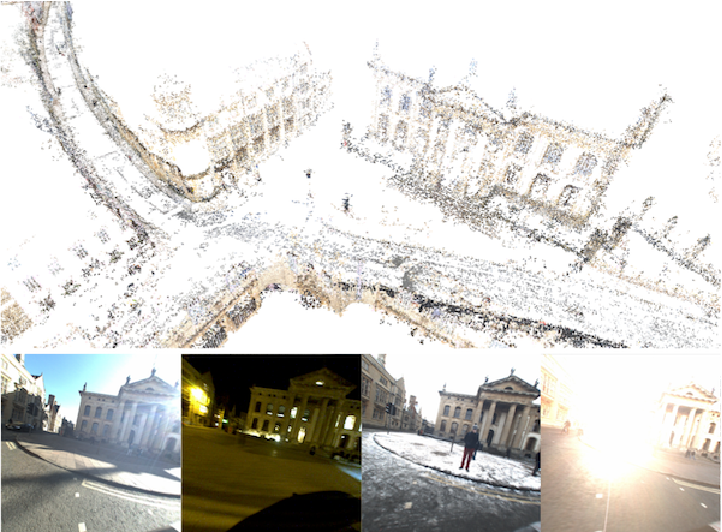
MultiSet's video says its map was "built from photos of one overcast day" too, so it presumably uses the same reference traversal. It shows a textured mesh rather than the benchmark's sparse cloud, which suggests MultiSet built its own map from the reference images. The post does not say how.
Localising one photo
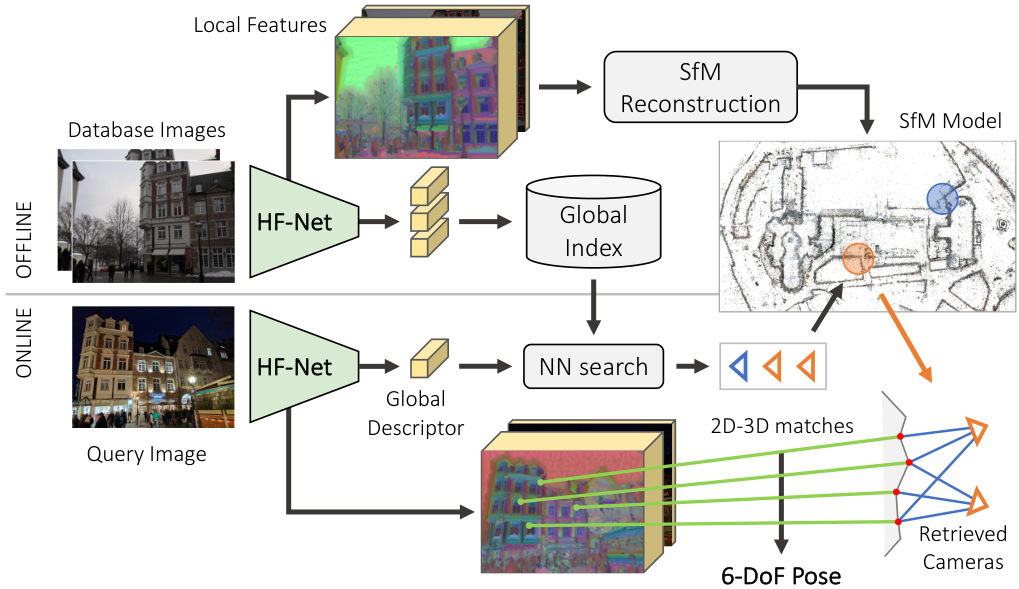
The standard pipeline is the one in hloc, the toolbox from Sarlin et al.'s "From Coarse to Fine" (CVPR 2019), the paper that introduced HF-Net, and it is still the baseline that MultiSet's own explainer names. It has four steps.
- Retrieval. A network turns the whole query image into one global descriptor (NetVLAD in the original, newer ones since), and a nearest-neighbour search over the database images' descriptors returns the top few database images that look most like the query. This narrows a city-sized map to a few dozen images' worth of 3D points.
- Local matching. Features in the query are matched to features in those retrieved images. Each database feature that belongs to a triangulated 3D point turns its match into a 2D-3D correspondence: this pixel in the query shows that point in the map.
- Pose from correspondences. Solve for the camera pose that projects the 3D points onto their matched pixels.
- Refinement. Re-solve on the inliers by minimising reprojection error.
Step 3 is Perspective-n-Point. With a calibrated camera (intrinsics known), a 3D point in the map and its matched pixel are related by
where and are the unknown rotation and translation and is the point's depth. Six unknowns; each correspondence gives two equations, so three correspondences pin the pose down (P3P, which returns up to four candidate solutions; a fourth point picks one).
The trouble is that the matches are not all right. Some descriptors match the wrong 3D point: a repeated window, a lamp post that looks like every other lamp post, a car parked in the query that was not there on mapping day. A least-squares fit over all matches is dragged off by every wrong one. So the solver runs inside RANSAC: draw three matches at random, solve P3P, count how many of the other matches the resulting pose explains to within a few pixels, keep the pose with the most support, repeat. If a fraction of matches are correct, a random triple is all-correct with probability , and the number of draws you need to see at least one clean triple with confidence is
At and that is 11 draws. At it is 169. At it is 4,603. Inlier ratio is what makes localisation easy or hard, and conditions change the inlier ratio.
The widget below is the same pipeline with one dimension removed so it fits on a page. The street is seen from above, and the camera is a 1D camera: each match says "this map point appears at this bearing in the photo". The pose is three numbers (x, y, heading), each match gives one equation, so the minimal sample is still three matches. The minimal solver fixes a heading, intersects two bearing lines to get the camera position, and searches for the heading at which the third bearing agrees, which can have more than one answer, just as P3P can. RANSAC and the refinement are the real thing.
Things to try: on the overcast preset, RANSAC finds the pose to about 6 cm with 100 draws, because 23 of 33 matches are good and 12 draws would do. Switch to night. Only 7 of 24 matches are good, the required draws jump to 184, and the estimate lands 2.7 m and 3.6° off. It passes only the coarse (5 m, 10°) band, and raising the iterations to 1,000 changes nothing: RANSAC does find the clean triples, but seven good matches with this much noise do not pin the pose down. That is the night problem in miniature, fewer matches as much as wrong ones. The learned-features preset gives back enough good matches (15 of 33) to land at 13 cm. Push wrong matches past 80% and there is often no pose at all. The presets are mine and illustrative; they show the shape of the problem, not anybody's measured match statistics.
What night does to a feature
The classic local feature is a SIFT-like descriptor: a histogram of gradient orientations around a keypoint. It survives a change in brightness and a moderate change in viewpoint, which is why it served SfM for two decades. It does not survive a change in what the gradients are. At night the facade that carried texture by day is a black plane with a few lit windows; sodium lights cast shadows that run the opposite way; headlights flare; and a long exposure smears everything along the direction of travel. The detector fires in different places and the descriptors that do come back describe different patches.
RobotCar Seasons measured how bad this was in 2018. Its Table 4 reports Active Search, a standard structure-based method of the time, placing 36.2% of dawn queries within (0.25 m, 2°), 51.3% of rain and 33.1% of overcast-winter. At night: 0.5%. Night-rain: 1.4%. Even at the coarse (5 m, 10°) threshold, night was 3.4%. The paper's explanation for the night versus night-rain gap is the one you would not guess: the cameras' auto-exposure picked a longer exposure for the dry night, so the dry night images have more motion blur.
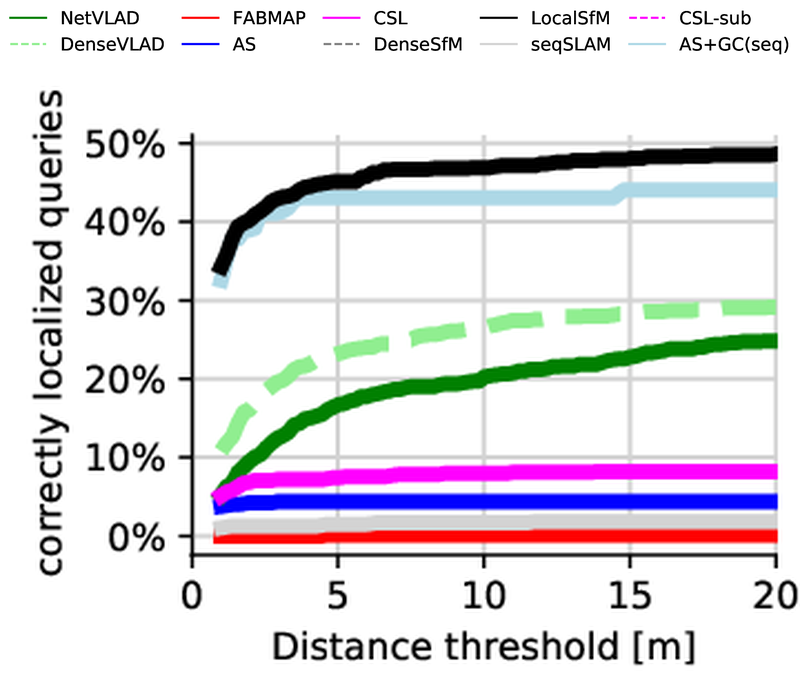
The same table shows day conditions as the easy part. The paper's reason: "seasonal changes have little impact on the building facades that are dominant in most query images". Dawn and sun were the exceptions, from overexposure in direct sunlight.
Learned features changed the night numbers. SuperPoint learns a detector and descriptor from data, R2D2 learns to predict which points are reliable, SuperGlue and later LightGlue replace nearest-neighbour matching with a network that matches whole sets of features using their context, and retrieval moved from VLAD-pooled CNN features to much stronger global descriptors. None of these make night look like day. They make more of the night matches correct, which is the in the RANSAC equation, and more correct matches is what turns a 0.5% night into a usable one. The SuperPoint pruning work I covered in PrunaSuperPoint is the same front end, cut down to run on a Jetson.
The failure modes did not go away, they got rarer. The HF-Net paper's qualitative figure for RobotCar night sorts its queries into three columns.
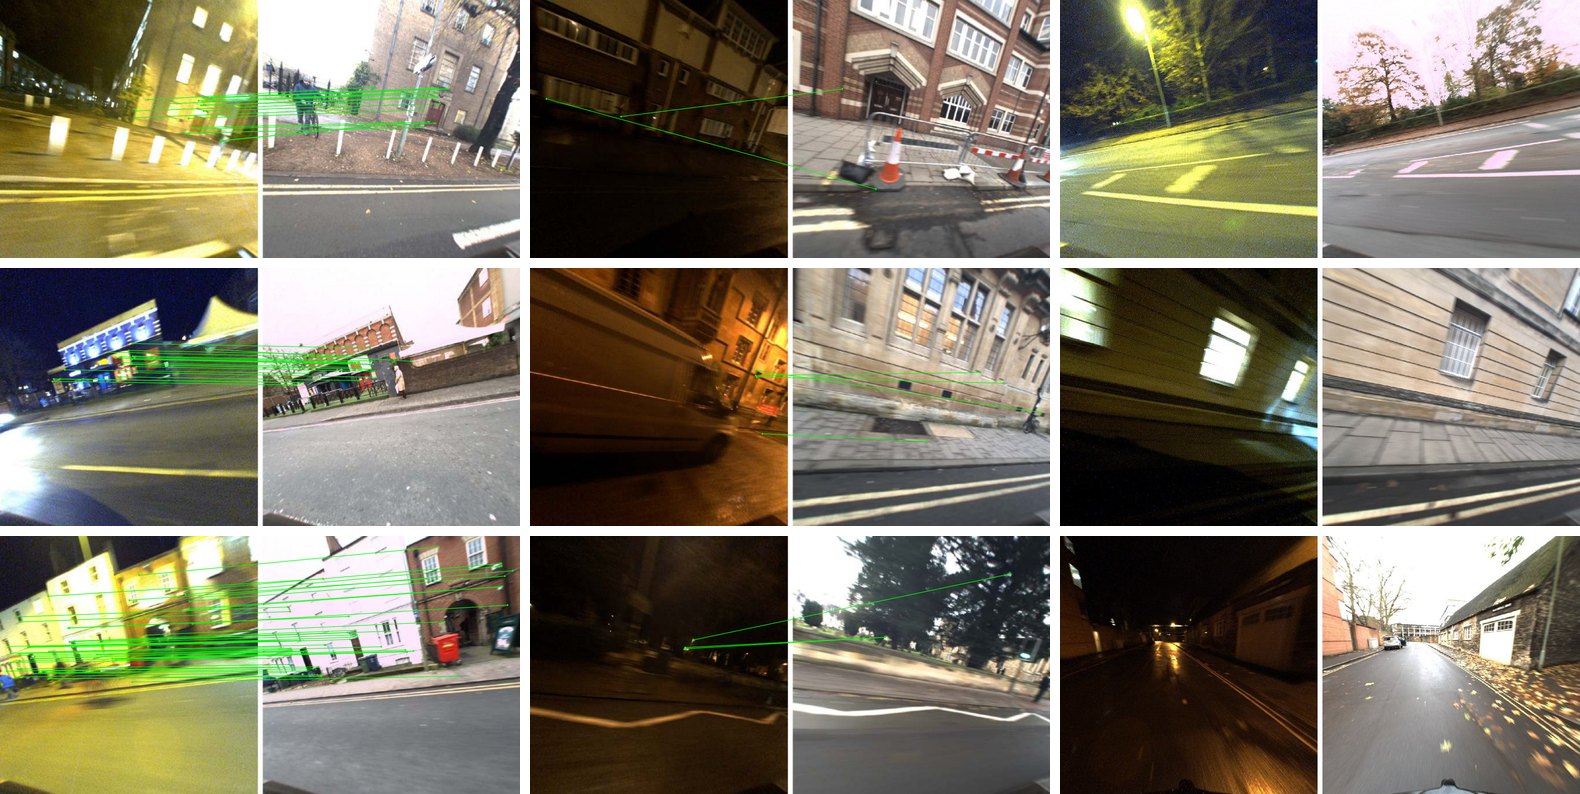
That figure is the whole failure taxonomy of a VPS. Retrieval picks the wrong place, or the right place yields too few correct matches. Everything a modern system improves attacks one of those two.
The benchmark MultiSet chose
RobotCar Seasons comes from the Oxford RobotCar dataset (Maddern et al., IJRR 2017), a car that drove the same 10 km route in central Oxford a hundred times over a year. Sattler et al. picked one reference traversal and nine query traversals. The paper's appendix table gives the dates and image counts:
| Condition | Recorded | Images |
|---|---|---|
| overcast (reference, the map) | 28 Nov 2014 | 20,862 |
| rain | 25 Nov 2014 | 1,263 |
| night | 10 Dec 2014 | 1,314 |
| dawn | 16 Dec 2014 | 1,449 |
| night + rain | 17 Dec 2014 | 1,320 |
| snow | 3 Feb 2015 | 1,467 |
| dusk | 20 Feb 2015 | 1,182 |
| sun | 10 Mar 2015 | 1,380 |
| overcast, summer | 22 May 2015 | 1,389 |
| overcast, winter | 13 Nov 2015 | 1,170 |
So "about a year" is right: the last query drive is fifty weeks after the map. The car carries three cameras (left, rear, right), and queries come as synchronised triplets, which is why the leaderboard has single-camera and multi-camera entries.
The scoring is fixed. A query is localised at a threshold if its position error and its rotation error are both under the limits: (0.25 m, 2°), (0.5 m, 5°) and (5 m, 10°). The score is the percentage of queries that pass, reported separately for day and night. A query that returns no pose counts as a failure. The thresholds, the paper says, "were chosen to reflect the high accuracy required for autonomous driving."
The ground truth is worth knowing about, because MultiSet's cards measure against it. GPS on the car drifts, and night images do not match day images well enough to add them to the SfM model, so the benchmark's authors built local LIDAR point clouds per condition and aligned them with ICP to the reference traversal's LIDAR. The follow-up paper, Toft et al.'s "Long-Term Visual Localization Revisited" (TPAMI), states the result: final median RMS errors between aligned point clouds were "under 0.10m in translation and 0.5° in rotation across all locations."
That paper also made the v2 split that the leaderboard uses now. It released poses for around half the query images, "for a total of 26,580 images", and kept "the remaining 5,616 images" as a hidden test set scored by the server at visuallocalization.net. That split matters below. You can compute your own error on the public half. You can only get a test score by uploading poses to the server.
What the video shows, query by query
I stepped through the video a second at a time and read every card. Each one prints a condition, a running count (01 / 27 to 27 / 27) and an error pair "from the reference pose".
| Condition | Query 1 | Query 2 | Query 3 |
|---|---|---|---|
| Overcast, winter | 5 cm · 0.6° | 8 cm · 0.6° | 9 cm · 0.6° |
| Rain | 19 cm · 0.9° | 10 cm · 0.9° | 12 cm · 1.1° |
| Dawn | 19 cm · 0.3° | 18 cm · 0.3° | 13 cm · 0.3° |
| Sun | 14 cm · 0.6° | 8 cm · 0.4° | 17 cm · 0.6° |
| Night | 18 cm · 0.8° | 22 cm · 0.9° | 24 cm · 0.6° |
| Dusk | 20 cm · 0.5° | 20 cm · 0.5° | 14 cm · 0.5° |
| Snow | 21 cm · 0.6° | 13 cm · 0.6° | 20 cm · 0.6° |
| Overcast, summer | 14 cm · 0.9° | 7 cm · 0.9° | 8 cm · 0.9° |
| Night, rain | 14 cm · 0.1° | 19 cm · 0.1° | 17 cm · 0.2° |
All 27 are inside the finest threshold. The worst is 24 cm, a night query. Rotation never passes 1.1°.
Those are good results for those photos. In 2018 Active Search put 0.5% of night queries inside 25 cm. Three night queries landing at 18 to 24 cm, and three night-rain ones at 14 to 19 cm with rotation at 0.1° to 0.2°, are what a modern learned pipeline should be able to do on its successes. Nothing here looks implausible.
What is missing is everything else.
No rate. The benchmark's output is a percentage at three thresholds. The post, the thread and MultiSet's site give none for RobotCar. The video's 27 cards are three per condition, chosen for a video. They are a showreel.
Closer to nine places than 27. Within each condition the three photos are the same stretch of street a moment apart: the same parked cars, a little further along. The rotation errors say the same thing, identical within most trios (0.6°, 0.6°, 0.6° for overcast winter; 0.3° three times for dawn; 0.9° three times for overcast summer). So the video shows nine locations, one per condition, each localised three times in quick succession. Consecutive frames of one place succeed or fail together, so the trio is not three independent tries.
Not on the leaderboard. As of 13 November 2026 there is no entry under MultiSet's name in either the RobotCar Seasons or the RobotCar Seasons v2 table. Submissions can be anonymous (several 2026 rows are named things like chicken and 04-09-2026), so I cannot say they never submitted. I can say nothing public connects a row to them.
Probably the public half. A card that prints an error against the reference pose needs that pose. The test half's poses are withheld, so these 27 are presumably from the roughly half of queries whose poses were released. That is my inference from how the dataset is split, not something MultiSet states. It is a fine set to develop on. It is not the set the board scores.
Errors at the size of the ruler. The reference poses come from LIDAR alignments with a median RMS error under 10 cm and 0.5°. Most of the cards report 5 to 24 cm and 0.1° to 1.1°. At that scale, the difference between 8 cm and 14 cm says as much about the reference pose as about the system.
How unlikely is 27 out of 27 by chance? The v2 board's best row today, FUSED_inl_clsgeo_krr_pub, places 69.2% of day queries and 66.2% of night queries within (0.25 m, 2°). If MultiSet were exactly that good and the 27 had been drawn at random (21 day, 6 night, the video's mix), the chance that all of them pass would be
about 1 in 27,000. For hloc with SuperPoint and SuperGlue on a single camera (64.8% day, 39.2% night) it is about 1 in 2.5 million. Nobody claims the 27 were drawn at random, and that is the point: picking the clean ones is what makes the number uninformative. The widget below puts the cards next to the board.
Switch the board to (0.5 m, 5°) and the odds look different: 28% for the top row, 8% for single-camera hloc. Every row in the widget passes 94% or more of day queries at that threshold, and at (5 m, 10°) most of the board sits at 100% for day. Day is close to solved on this benchmark. The open question is night at the fine threshold, where the board's spread is widest: 39.2% for single-camera hloc, 45.0% for hloc on all three cameras, 51.5% for MegLoc and 66.2% for the top row. That is the column a MultiSet entry would need to fill.
MultiSet already knows how to report a benchmark
This is the part that makes the RobotCar post odd. Ten days earlier, MultiSet published Gen2.5's results on LaMAR, the AR localisation benchmark from ETH Zurich and Microsoft (Sarlin et al., ECCV 2022). That post does it properly. It reports recall per scene at (10 cm, 1°) and (1 m, 5°): 79.74% mean at the fine threshold against 74.24% for ImLoc and 68.80% for hloc, as MultiSet quotes those from ImLoc's Table 2. It says each of the 1,477 phone queries went in as one image, that "Low-confidence rejection was off", and that Gen2.5 "returned a pose for 1,476 of the 1,477 queries, and the one without counts as a miss." And it says which split: "We ran the validation split, which has public ground truth", with the note that "ImLoc also reports LaMAR's held-out test split, scored by the benchmark server. Our results are on the validation split only."
That is a self-run number on the public split, so it is still not a server-scored result, and the post says so itself. But it is a recall, with a denominator, a miss policy and a named split, and anyone with the LaMAR data can check it. The RobotCar video has none of those. My guess is that the RobotCar run exists in full somewhere inside MultiSet and the video is its highlight reel. If so, publishing the table the LaMAR post has would cost them a paragraph.
Photos that land where they were taken
Shadnam Khan's trade-show video is a flythrough of an expo hall in Atlanta captured as one scan, labelled "From the AES floor".
Those two jobs are the right ones, and they ask different things of the system.
Pinning a site photo to a model is an error-tolerance question. For an issue photo on a construction site ("crack at this column", "missing fire stop at this penetration") the photo needs to land at the right element. Half a metre and five degrees is usually enough, because a person reading the issue sees the photo and the model together. That is the RobotCar middle threshold. At night the top v2 row passes 95.3% of queries there and MegLoc 90.0%; single-camera hloc passes 80.0%.
Finding a valve is a retrieval question in a building full of near-identical valves. Repetition, not illumination, is the hard case: identical floors, rows of the same pump skid, the same column grid every eight metres. That is the failure in the middle column of the HF-Net figure, retrieval confidently choosing the wrong place. MultiSet's LaMAR post says Gen2.5's changes were aimed at exactly this ("better at telling look-alike places apart"), and its reported lead over ImLoc is widest in LaMAR's symmetric halls. RobotCar is a weak test of that. Its route is a street, and the paper itself notes that retrieval works well on it because "the car follows the same road".
A construction site has one problem Oxford's facades do not. Oxford barely changes in a year; Sattler et al. leaned on that, since day-time seasons hardly moved the numbers. A site changes every week. The map you captured during formwork shows things that are gone by the time the slab is poured, and the query shows things the map never saw. Lighting is temporary, and the night shift works under floodlights. Queries are often 360 frames, which MultiSet's v2.3.0 release says it handles "from one 360° panorama with no calibration data". None of that is in RobotCar Seasons, and the RobotCar video is no evidence for or against it.
What I would want before trusting a VPS on a site is the RobotCar protocol, moved indoors: map on day one, hold out photos from weeks two, six and twelve, report the share inside (0.5 m, 5°) and inside a looser room-level band, and report the no-pose rate and the wrong-pose rate separately. A wrong pose is worse than no pose: it puts a defect photo on the wrong column, and nobody notices until someone walks there. MultiSet's v2.3.0 notes mention catching "localization results that are confidently wrong", which is the right thing to work on. It is also the number I could not find.
Where I land
I believe the pipeline works on RobotCar Seasons, including at night. The cards are consistent with what learned-feature localisation does on its successes, and MultiSet's LaMAR post shows they can run a benchmark carefully when they want to. I do not accept the video as a result. It is 27 successes chosen from a set of thousands, measured against reference poses whose own error is about the size of the numbers on the cards. The benchmark's whole contribution is the denominator, and the denominator is the thing left out.
If MultiSet uploads its poses for the 5,616 hidden queries to visuallocalization.net, the board will answer the question in an afternoon: day and night, at three thresholds, next to hloc and everyone else. Until then, read the video as a demo of the interface and of what a successful night localisation looks like, which it shows well. Read the LaMAR post for an actual number. For a site, run your own held-out photos.
The general pipeline, from capture to splat to map, is in Gaussian-splat capture in practice. Its fifth section covers an earlier MultiSet demo that placed crowd-sourced Westminster photos onto Google's 3D Tiles. For LiDAR maps and the floor-by-floor problem a VPS map has to sit on, see the open robotics mapping roundup.