2026-11-09 · 15 min · kernels · cuda · nvidia · megakernels · inference · training · benchmarks · reproducibility
Why read this
Solidtop 85%Parses all 42 shipped B300 cubins on a CPU, reproduces the 30.6% training MFU, and separates the thread's claims from what the repo backs.
- Original analysis
- Concrete numbers to act on
- Explained from first principles
GPUs, kernels & systemsNeeds datacenter GPUsMITPractitioner tool
How this was scored
- Is it new?
- 1 of 3: An incremental tweak
- Can I trust it?
- 2 of 3: Measures key facts from files, code or configs
- Can I run it?
- 1 of 3: API-only, gated or restrictive licence
- Will I understand it?
- 2 of 3: Mechanism from first principles with figures
- Can I act on it?
- 2 of 3: A concrete recipe, numbers or comparison
- Will it last?
- 1 of 3: Relevant for months
- Does it affect many?
- 1 of 3: A specialist community
- Only here?
- 2 of 3: A teardown or measurement few others did
Score 55 of 100, ranked 529 of 701 rated articles. Each question is answered 0–3 by hand, and a 3 is rare. How articles are scored
On 5 November @hyperstition_cc posted an eleven-part thread that opens: "We invented a recursive megakernel generator called Hyperkernel, the most complete solution to megakernels and GPU efficiency." The megakernels it generated, the thread says, "achieve state of the art performance on 11 different domains": DeepSeek, Kimi and GLM inference, Qwen pretraining, hardware fault recovery, two robot policies, a world model, openpilot, Moshi, Evo 2 and ESMFold. "All of this in a single kernel launch." Generation took "under 50 minutes" for robotics, genomics and voice, at "about 60-100 lines of code per megakernel."
The repository is Hyperstitioncc/Hyperkernel, MIT licensed, one commit (5f30018, 10 November). The thread itself says what is in it: "Our first release today open sources the megakernels themselves. Over the next couple weeks, we will release the entire Hyperkernel stack." So the generator, the thing the headline is about, is not out. What I can check is what it produced.
- license
- MIT
- branch
- main
- tests
- 24 files
- source
- 641.7 kB
- commit date
- 2026-11-10
by size of tracked source at this commit, file counts in brackets; docs, data and vendored trees excluded
local clone, 2026-11-10 at 5f30018 — branch, commit, commitDate, fileCount, hasTests, languages, license, licenseFile, shallow, testFileCount
shallow clone: counts describe the pinned tree, not the history
I have no B300. What follows is what a CPU can establish about 42 GPU kernels without running them: what each one is, how the host drives it, which of the thread's numbers the repo contains, and whether the one number it does contain adds up. Every claim carries a label. Measured means I computed it from the repo's files. Reported means the thread or the repo says so and I could not rerun it. Reasoned means arithmetic on one of those, with the assumptions stated.
What a megakernel buys
A model's forward pass is normally a few hundred kernel launches. Each launch costs host time, and each kernel starts cold: it loads its operands, computes, writes its result to HBM and exits, and the next kernel reads it back. At large batch the matrix multiplies are big enough to hide that. At batch 1 they are not. A decode step for a small or medium model spends a large share of its time in the gaps.
A megakernel is the alternative. Launch one kernel with one block per SM (streaming multiprocessor). Never let the blocks exit. Give them a schedule of every operation in the forward pass, and have them synchronize with each other on the device instead of returning to the host. Tiles of the next layer's weights can be loaded while the current layer still computes, because nothing ends between them.
This site has looked at three of these this autumn. MegaBake compiles a PyTorch FX graph into one persistent CuTe DSL kernel driven by a phase table. Inferact's Kimi K3 TPU megakernel runs all 92 layers as one Pallas call. vLLM's Kimi K3 path on GB300 turned out not to be one kernel at all, but 13 kernels a layer. The hard parts are always the same: a barrier that does not deadlock, a schedule that keeps every SM busy when layers have different shapes, and correctness checks good enough to trust the result.
Hyperkernel's pitch is that one generator does this for any model. Hyperstition does not say what recursive means, and the release cannot answer it: there is no generator source, no prompt, no agent loop, no compiler pass. Nor can I check 60-100 lines of code per megakernel (reported), because the code those lines are written in is not shipped. What ships is machine code.
What is in the repository
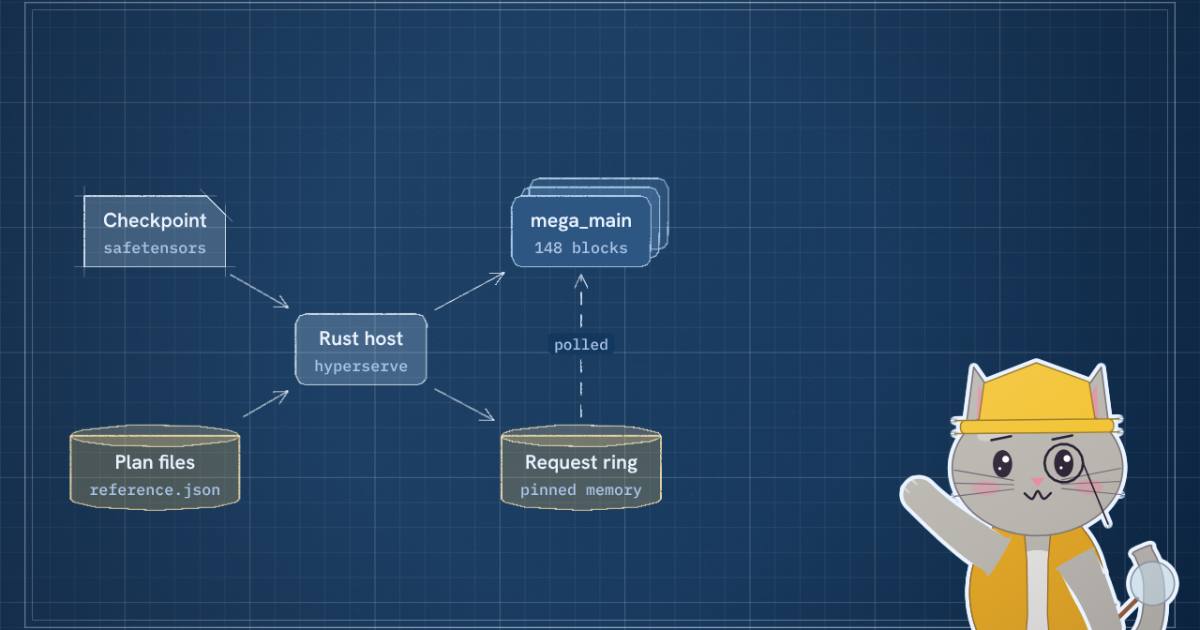
The repo is a Rust crate called hyperserve (14,564 lines in src/, measured) and a kernels/b300/ directory of zstd-compressed bundles, 51 MB on disk (measured). The README names the host: "This repository contains the public implementations of the Megakernels generated by the Hyperkernel." A bundle holds:
entry.cubin: the compiled kernel, built forsm_103a(the B300's architecture, read from the SASS header).entry.sass: its disassembly, for 37 of the 42 bundles. Evo 2 and Matrix-Game ship cubins only.loaderN.cubin: small helper kernels that lay out weights and build TMA (tensor memory accelerator) descriptors before the first launch.reference.json: the launch shape, the memory map, the ports, and a list of write and load records the host replays to set the kernel up.rankN.json: per GPU, where each checkpoint tensor goes and how to transform it on the way in.
The host never has to understand the model. It reads the plan, copies tensors from your safetensors files to the addresses the plan names, runs the loaders, and launches mega_main. All model knowledge lives in the cubin and the plan, which is consistent with a generator that emits both.
I wrote a short ELF reader in Python (stdlib plus the zstandard package; no NVIDIA tools, no repo code) and pointed it at every entry.cubin. Since Volta every SASS instruction is 16 bytes, so the size of the .text section divided by 16 is the instruction count. For the 37 bundles that also ship entry.sass, I counted instruction lines in the listing as a cross-check. The two counts agree exactly in all 37 (measured).
What that shows, all measured:
- Each bundle is one function. Every cubin has exactly one
.textsection. The training kernel is namedentry; the other 41 aremega_main. - They all have the same shape. Every kernel asks for a grid of 148 blocks of 384 threads, and 232,448 bytes of dynamic shared memory (232,400 for training). 41 of 42 are cooperative launches, the CUDA mode that guarantees every block is resident at once, which a grid-wide barrier needs.
- They are large. The smallest, ESMFold's language-model pass, is 27,656 instructions. The largest, the DeepSeek kernel for five concurrent users, is 567,304. All 42 come to 4,244,616. For scale, MegaBake's whole SmolLM kernel is a 1,638-line source file.
- The code is specialized, not parameterized. DeepSeek-V4.1-Flash has a separate kernel per maximum concurrency: 247,592 instructions for one user, 343,512 for two, 447,896 for four, 567,304 for five and eight. ESMFold has one set of three kernels per protein length, nine lengths from 76 to 248 residues, and the host refuses any other length. That is what you get from a generator that unrolls the model into straight-line code for one exact shape, and it is the opposite of a general runtime.
- Tensor cores are there. The listings contain
UTCHMMAand related instructions, Blackwell's tcgen05 tensor-core MMA, which accumulates in tensor memory. The DeepSeek c1 kernel has 234 such sites, 334 TMA sites and 3,172 barrier and mbarrier sites. Those are places in the code, not executions.
None of this says the kernels are fast. It says they exist, that they are real Blackwell code of the size a fully unrolled model would produce, and that the cubins match their listings.
"A single kernel launch," read from the host
The host code says how many launches each model takes, and the answer splits into three patterns (measured, read from src/, not observed on a GPU).
Launched once, fed through a ring. The DeepSeek server and π₀-FAST launch their kernel once at start-up and leave it running. The host pushes each request into a ring buffer in pinned memory and reads replies from another. This is the purest form of the idea: the kernel is the server. One detail: kernels with a thread-block cluster above 2 (the DeepSeek and π₀-FAST kernels use clusters of 16) are launched as two parts of the same function, a clustered part and a dependent part, because clusters of 16 cannot tile 148 blocks evenly. It is still one resident program.
One launch per call. ACT launches once per camera frame, with the ResNet-18 backbone, the transformer and the action head inside it. openpilot launches once per frame. The Qwen training kernel launches once per optimizer step, forward, backward and update together. These match the thread's wording.
Several kernels per call. A protein fold with ESMFold is nine launches: the ESM-2 language model, then the folding trunk and the structure module for each of four recycles (src/esmfold/fold.rs runs and tests exactly that sequence). Matrix-Game launches a chunk kernel and a VAE kernel for every 40 frames. Evo 2 runs a prefill kernel and then launches its step kernel once per generated base, with the host sampling each base in between. Each of these launches is a megakernel. The whole job is not one.
So "all of this in a single kernel launch" holds for four of the eight shipped models and is a stretch for the other four. That is not a criticism of the engineering. Nine launches per fold is still far fewer than an eager PyTorch ESMFold, and returning to the host between recycles is a sensible place to break. It is a criticism of the sentence.
Which claims the repo backs
The thread gives a speed number for almost every model. I grepped every text file in the repo for those numbers, and for any results table, benchmark log or baseline script.
The DeepSeek logs are the most careful thing in the release, and they are about correctness, not speed (measured, read from logs/). The c1 kernel was compared with SGLang on 15 prompts, from 8 to 59,741 tokens. Top-1 agreement is 0.976 and mean KL divergence 0.0147 over 1,638 positions. The useful number is the noise floor: SGLang compared against itself, decode against scoring, gives a mean KL of 0.0131. So the megakernel disagrees with SGLang about as much as SGLang disagrees with itself. A second log runs every preset out to a 1M-token context: mean KL between 0.0213 and 0.0234 per preset, and a needle found in all 15 haystacks of up to 1,040,000 tokens, for every preset. Two identical runs agree on 0.998 of top-1 tokens. And all 107 cubins in the branch loaded and resolved their entry functions on a B300. That is the kind of evidence a megakernel needs, because a fused kernel that drifts numerically is worse than a slow one.
What the logs do not contain is a single throughput or latency figure. The 36.7% at concurrency 1 (reported), and the five other DeepSeek comparisons in the thread, are against "NVIDIA's published vLLM results" and an "AgentX" result, with no file in the repo saying which published run, which vLLM version or which settings.
The same pattern holds for the rest. The repo ships the kernel and a timer for ACT, openpilot, π₀-FAST, Matrix-Game, Evo 2 and ESMFold, and not one result file or baseline script for any of them. Someone with a B300 and the weights could rerun the megakernel side. Nobody can rerun the other side from what is here. Two baselines are the authors' own "custom reference PyTorch + CUDA graph" code, which is not released. The π₀-FAST figure uses a separate benchmark kernel, pi0fast-fixed60, that decodes exactly 60 tokens with end-of-sequence detection off. That is a fair way to time decode, but it is not the kernel the CLI runs by default. ESMFold's "structures matching the reference within 1 Å" has no structure file and no comparison script behind it.
Three of the eleven models have no kernel at all. Kimi and GLM are promised with the serving stack. Moshi, "6.8 ms per frame versus 9.45 ms" (reported), appears nowhere in the repo, in any README, source file or script.
The one number that adds up
The Qwen3-30B-A3B training bundle is different. Its launcher script's help text says: "Measured with this package: 491.58 ms, 30.6%." It also says exactly how MFU (model FLOPs utilization) is computed, and reference.json holds the inputs:
is FLOPs per training token, the parameters a token touches, layers, query heads, the head dimension, and 2048 the sequence length. The bundle stores = 20,665,860,096 and a peak of 2.25 PFLOP/s per GPU, which the script calls NVIDIA's dense BF16 peak for B300.
I checked both halves (measured). The arithmetic: 20,665,860,096 × 131,072 tokens is 2.709 PFLOP per step; over 491.58 ms that is 5.51 PFLOP/s, and divided by 18 PFLOP/s of peak, 30.61%. And the FLOP count: summing the 18,867 tensor shapes in reference.json gives 30,532,122,624 parameters, 28,991,029,248 of them in 128 experts and 311,164,928 in the input embedding. Taking 8 of 128 experts, every other weight except the embedding and the norm scales, and the output head gives 3,041,656,832 active parameters. Six times that plus the attention term is 20,665,860,096, the stored value exactly.
The choices in that count are the conservative ones. The attention term is the causal half, rather than ; the full square would report 34.2% from the same run. Leaving the embedding lookup out is standard, since it is a gather and not a matrix multiply; counting it would report 33.4%. A team trying to inflate MFU had two easy levers and pulled neither. The 31% in the thread is this 30.6%, rounded.
Two things the bundle cannot tell me. The 491.58 ms is a report: I cannot time it. And "11% higher MFU compared to NVIDIA's Qwen 30B MoE implementation" (reported) has no baseline in the repo, not even which reading of 11% is meant. If it is relative, NVIDIA's number would be 27.6%. If it is 11 points, 19.6%. Those are different claims about the state of the art.
"Hardware fault detection and replanning"
The thread lists fault recovery as a domain: "We have the most complete pretraining megakernel with hardware fault detection and replanning." What the released training code has is detection (measured, read from src/bin/qwen30b_train.rs). The kernel's control block carries a watchdog word, a stop word and bounds and range flags. The host waits on each step with a timeout of at least 120 s, raised to three times any step that ran slower. If either side trips, the host prints a HANG line and exits with code 3:
HANG: rank {me}: the kernel's own {} s limit tripped at step {s}. No result:
this kernel has shown intermittent hangs like this one. The run's timing is void;
run it again.
The help text says the same in plain words: "A step that does not finish in time ends the run with a HANG line and no result: such hangs happen intermittently; run again." An out-of-bounds flag ends the run with an error. There is no replanning path. I searched every text file for replan and recover and found neither.
Credit where it is due: a persistent training kernel that can hang, and a host that says so instead of printing a number, is honest engineering. A grid-wide barrier that waits on a block which never arrives is the classic megakernel failure, and a watchdog is the right first defence. But a watchdog that voids the run is not the fault recovery the thread describes, and the shipped training kernel has, by its authors' account, an intermittent hang.
Where the numbers sit against the hardware
One more check needs no GPU: compare a claimed time with the time it takes just to read the weights. At batch 1, a decode step has to stream every weight from HBM at least once, so bytes over bandwidth is a floor no kernel can beat.
Evo 2's step kernel has 13.17 GB of tensors filled from the checkpoint (measured, summed from its rank0.json; another 85.9 GB is zero-filled cache for a 1M-position context). The B300's HBM3e is specified at about 8 TB/s. Reading 13.17 GB takes at least 1.65 ms (reasoned). The thread's 9.0 ms per base (reported) is about 5.5 times that floor, and the stock 27.3 ms about 17 times. Some of the gap is real work the floor ignores: Evo 2's convolution and attention state, and a host round trip per base to sample it. But a 3x win over the stock code still leaves most of the floor unclaimed, which says as much about the baseline as about the megakernel.
π₀-FAST is closer. Its kernel holds 6.9 GB of checkpoint tensors (measured), so 60 decode steps that each read everything would take at least 52 ms (reasoned, and an overestimate, since the vision encoder runs only once). The reported 94 ms, prefill included, is within 2x of that bound. If the number holds up, that is a tight kernel.
Reading Hyperkernel today
What I could and could not do:
- Ran (measured). A shallow clone of commit
5f30018. My own Python reader over all 42entry.cubinfiles and the 37entry.sasslistings: section tables, instruction counts, opcode sites. The SHA-256 of the decompressed training cubin and listing match the hashes in itsreference.json. JSON summaries of everyreference.jsonandrank0.json. The MFU arithmetic and the parameter count. A grep of every text file for the thread's figures. - Did not run. No kernel: there is no B300 here, and the cubins are
sm_103acode nothing else can execute. Notcargo testeither: the sandbox's permission layer refused to build and run the repo's Rust code, so I read the tests and the repo's own record of them (logs/dsv41-c1/tests.txt: 147 passing, 9 ignored) instead of reproducing it. - Could not check at all. The generator, what recursive means, the 50 minutes, the 60 to 100 lines, and every speed comparison except the MFU.
If you have the hardware, the release is unusually easy to try. One cargo build, a checkpoint at a pinned revision, and one command per model; the README is clear about GPU counts and memory (the DeepSeek server wants 4 B300s and about 203 GB of host RAM). The DeepSeek correctness logs are the right model for what a megakernel release should include. If you are evaluating the generator, wait for it. A pile of cubins proves that something produced them; it does not show how much of that something was a model, a compiler or a person, and the thread's 20 days and 50 minutes are about that part.
The one thing I would ask Hyperstition for is the other half of each comparison: the baseline scripts, the published runs they quote, and a results file per model. The kernels are already the hard part, and they are out.