2026-11-12 · 26 min · vector-search · optimization · algorithms · retrieval
A 3:43 narrated explainer, drawn in code. Every number and picture in it is this article's own; the sources are below.
› transcript
Every IVF index in FAISS starts as twenty-five full passes of k-means. What if two or three were enough? Hi, I'm Wrenly! This is e-means, from Meta FAIR, now in FAISS. Watch the two algorithms move, and you'll see why. This is Lloyd's algorithm, on the authors' toy. Assign every point to its nearest centroid, then move each centroid all the way to the mean of its points. One move per full pass, and the loss only goes down. So a bad start never gets fixed. It gets polished. e-means changes one thing. It keeps a moving average of each cluster's count and sum, and takes many small steps per pass. Here is the whole update, as one step. Each update moves a centroid toward its cluster's mean in this batch. How far depends on the step, and on this batch's count over the faded count. Make the batch the whole dataset, with a step of one, and you get Lloyd back. Lloyd is one corner of this family. Same points, same bad start. Each mini-batch moves a centroid a fraction of the way toward its batch mean. A batch is a sample, so the centroids jitter. That noise pulls the crowded pair apart. Side by side, in this film's own simulation. Five blobs, and one bad start. Lloyd converges fast, and stays stuck. e-means takes small noisy steps, and a centroid finds the empty blob. Many small steps found what one exact step could not. The article has a playground that runs both for real. Sixteen hundred points, twenty-four centroids, the same random start. Press play. Lloyd, on the left, moves once per pass. e-means, on the right, is done after three. Six hundred small updates against Lloyd's twenty-five, and the blue curve ends just under the red one. It is not a clean sweep. Step to other seeds, and sometimes the ratio under the chart turns red. Lloyd wins that one. So run all forty seeds. At three epochs, e-means ends below Lloyd on twenty-eight of them. At one epoch, only ten. The laws are being stretched here, far below the sizes they were fitted on. Flip revival off, and it wins twenty-five seeds instead of twenty-eight. On this toy that is a small effect. At real scale it is not. On a million points, four thousand three hundred and thirteen clusters die without it, and forty-seven with the split. And nobody tunes it. Take a million points and three epochs. A fitted law picks the batch: sixty-five thousand five hundred and thirty-six. A second picks the peak step, zero point three six one. That is forty-eight updates, where Lloyd makes three. About four points per cluster each time. Sixteen noisy moves per pass, against one exact one. The paper's curves. One is Lloyd at twenty-five iterations. Blue, e-means, drops below it within a few epochs. The orange mini-batch baselines stall above the line. Across the datasets, e-means needs one point four to two point six epochs. Two cautions. The loss gain is fractions of a percent. The story is compute. And the laws were fitted on high-dimensional embeddings, not on tiny data. Lloyd was the costliest corner of a bigger family. Many small, noisy, scheduled steps get there in a tenth of the passes. To recap. A moving average, small noisy steps, and fitted laws. Thanks for watching! Every source is in the full article. I'm Wrenly. Bye!
Why read this
Hightop 30%Derives the e-means update from Lloyd's, checks the epoch and wall-clock claims table by table, and diffs the paper against the FAISS 1.16.0 code.
- Runs on a laptop CPU
- Original analysis
- Widely used
Developer tools & infraMITPractitioner paper
How this was scored
- Is it new?
- 2 of 3: A real new idea, method or capability
- Can I trust it?
- 2 of 3: Measures key facts from files, code or configs
- Can I run it?
- 3 of 3: Open, permissive, runs on reader hardware with instructions
- Will I understand it?
- 2 of 3: Mechanism from first principles with figures
- Can I act on it?
- 2 of 3: A concrete recipe, numbers or comparison
- Will it last?
- 2 of 3: A reference for a year or more
- Does it affect many?
- 2 of 3: A widely used model, tool or lab release
- Only here?
- 2 of 3: A teardown or measurement few others did
Score 73 of 100, ranked 85 of 740 rated articles. Each question is answered 0–3 by hand, and a 3 is rare. How articles are scored
Every IVF index in FAISS starts life as a k-means run. So do product-quantization codebooks, the SH palette in Gaussian-Splat-Lite, the buckets in a clustered-attention scheme like Latent Sparse Attention, and a fair share of data-curation pipelines. The algorithm behind almost all of them is Lloyd's, from 1957 (published 1982), and the default in FAISS is to run it for 25 iterations.
On 6 November 2026 a Meta FAIR group (Swann Bessa, Pierre-Emmanuel Mazaré, Gergely Szilvasy, Hugo Touvron, David Picard, Matthijs Douze, Hervé Jégou) posted e-means: outperforming k-means (in one-tenth the epochs). Three days later it shipped in FAISS 1.16.0 as faiss.contrib.e_means, with reproduction scripts and a blog post with a browser playground. The lead author's thread sells it as "an algorithm beating k-means in 10x fewer epochs" with "no hyperparameter tuning beyond k".
I read the paper, its appendices, the blog and the shipped Python. I did not run FAISS or the benchmarks; I have no H100 and the brief for this piece did not cover executing third-party code. What I did run is my own TypeScript implementation of both algorithms on a 2-D toy (it powers the playground below) and the shipped scaling-law formulas, re-evaluated by hand. Everything else is the paper's or the blog's number, and I say which.
What Lloyd minimises, and where it stalls
Given points and a count , k-means wants centroids that minimise the mean squared distance from each point to its nearest centroid:
Lloyd alternates two exact moves. Assign every point to its nearest centroid. Move every centroid to the mean of its points. Each move can only lower the objective: for fixed assignments the mean is the minimiser of squared distance, and for fixed centroids the nearest one is the minimiser per point. So the loss falls monotonically and the algorithm stops at a fixed point in a finite number of steps.
One update costs one full pass over the data. Twenty-five iterations means twenty-five reads of a billion vectors and 25 centroid moves in total. Almost all the FLOPs go into the assignment step (an nearest-neighbour search), and the paper's Appendix J spends its effort on exactly that kernel.
A monotone descent also has no way out of a bad basin. If the random start puts two centroids in one small blob and one centroid straddling two big blobs, each Lloyd step polishes that arrangement. The blog's toy experiments put numbers on it: on two blobs of very different sizes with , Lloyd stays stuck on 26% of 200 random starts against 3.5% for e-means, and on five blobs in a line with it is 46% against 0%. The standard fix is smarter seeding, k-means++, which samples starting centroids far from each other. It helps, but it is sequential and slow. In the paper's Table 12 the k-means++ draw on DEEP at a million points takes 2,852 s while the whole 5-epoch e-means run after it takes 22.3 s.
Why mini-batch k-means never displaced Lloyd
The obvious way to get more than one update per pass is to update from mini-batches. MacQueen did that in 1967 with one point at a time; Sculley's 2010 mini-batch k-means is the version in scikit-learn. Both keep, per cluster, a running sum and count and add each batch's contribution forever:
where and are the sum and count of the batch points assigned to cluster . The centroid is the mean of every point the cluster has ever been handed, including points it was handed early, when it sat somewhere else. That is a per-cluster learning rate of , which decays fast and never forgets stale assignments. The paper's own summary of the literature is that mini-batch k-means converges faster but to a higher loss than Lloyd, and Figure 3 below shows exactly that for Sculley and for the more recent Staleness-Reduction variant: both beat Lloyd at one epoch and then flatten out above it.
There is a second, practical problem the paper names: none of these methods tells you what batch size and step to use for a new dataset, so a practitioner has to sweep. Lloyd needs only and an iteration count. A method that needs a sweep has already lost the comparison before it starts.
The e-means update: forget at a fixed rate
e-means keeps the same two statistics and the same ratio, but replaces the sums with exponential moving averages, as VQ-VAE codebooks have done since 2017 (the paper cites van den Oord et al.):
Write the step as . A little algebra (the FAISS NumPy class stores and and does it this way) turns the update into a move toward the batch mean of the cluster:
The per-cluster step adapts by itself. A cluster that receives many points this batch relative to its recent history moves a lot; a cluster with a steady stream moves a little. Nobody tunes that per cluster.
The new centroid is a convex combination of the old centroid and the batch mean, with a weight between 0 and 1. It can never overshoot. Appendix E and the blog make this the reason they chose EMA over gradient descent on the centroids: at a large batch, the step that is optimal is also large, and SGD collapses past a critical learning rate while EMA degrades smoothly. The blog reports that at its best setting gradient descent ends 1.6% (DEEP) and 0.4% (SIFT) above the moving average. Adam and SparseAdam were tried too (Figure 16); all optimisers are similar at small batches and all fall behind EMA at large ones. Large batches are what keeps a GPU busy, so this decides it.
Lloyd is a corner of the same family. Set and : the old statistics are discarded and becomes the exact mean of its cluster over the whole dataset, which is one Lloyd iteration. I checked this on my implementation: with , a constant and revival off, the e-means trace matches Lloyd's to within in every coordinate over 10 seeds and 10 iterations. The blog's hyperparameter map (validation loss for every on DEEP, , ) shows that corner sitting well outside the band where the loss is lowest. That is the paper's real argument: Lloyd was never the optimum of this family, only its most expensive and least noisy member.
The noise matters. A mini-batch assignment is a sample, so centroids jitter; a centroid stranded between two blobs gets pulled one way and then the other until it commits. The thread's phrasing is that stochasticity helps e-means escape local minima that Lloyd polishes. I find the blog's 200-start experiments more persuasive than the slogan, but they are the same claim.
A cosine on the step, a split for the starving, an exact mean at the end
The moving average is the core. Three smaller pieces make it competitive, and the paper ablates each in Table 1 (DEEP, , , epochs, medians over 30 seeds).
The step anneals. The step starts at a peak and follows a cosine down to a tenth of it over the run's updates:
This is the learning-rate schedule every transformer trains with. Large early steps explore; small late steps settle. In Table 1, dropping the schedule costs 0.26% on train MSE and gains 0.06% on test, so it is a small train-side win. Appendix G.3 compares it with the best retuned constant step and finds the schedule better on train MSE in every configuration and on test most of the time.
Starving clusters are revived by splitting. Every five updates, any cluster whose moving count has fallen below of the mean count is rebuilt. A donor is drawn in proportion to its count, its centroid is perturbed two ways (multiplied coordinate-wise by with alternating signs), one copy stays with the donor and one goes to the dead slot, and each gets half the donor's count. The trick is borrowed from FAISS's own k-means, which splits empty clusters the same way. This is the biggest single item in the ablation: with revival off, train MSE is 2.97% worse and test 2.24% worse. Table 14 counts the casualties on DEEP at one million points: 4,313 dead clusters (26.3% of the codebook) with revival off, 2,343 (14.3%) when a dead slot is refilled with a random batch vector as EnCodec does, and 47 (0.3%) with the split. A mini-batch method has this problem much worse than Lloyd because a cluster that misses a few batches loses mass geometrically and stops winning assignments.
The run ends on an exact mean. During the last epoch e-means records each point's assignment, then sets every centroid to the plain mean of the points assigned to it in that epoch. It costs one division per cluster and is guaranteed to lower train MSE; Table 1 shows 0.14% on train. A second option, a slower moving average kept alongside and never used for assignment, trades a little train error for test error, which matters if the centroids will index vectors you have not seen yet.
Initialisation is random: distinct data points, with set tiny so that the first real batch dominates. k-means++ seeding helps a little (0.18% train, 0.11% test in Table 1), but at two orders of magnitude more time than the run, so the paper does not use it.
Choosing B and α₀ without a sweep
The "no hyperparameters beyond k" claim stands or falls on this section. The batch size and the peak step interact: Figure 2's left panel shows that for each batch size the validation loss has a valley in , and the bottom of the valley moves right as grows. The right panel shows the loss is flat across batch sizes until a knee, then climbs.
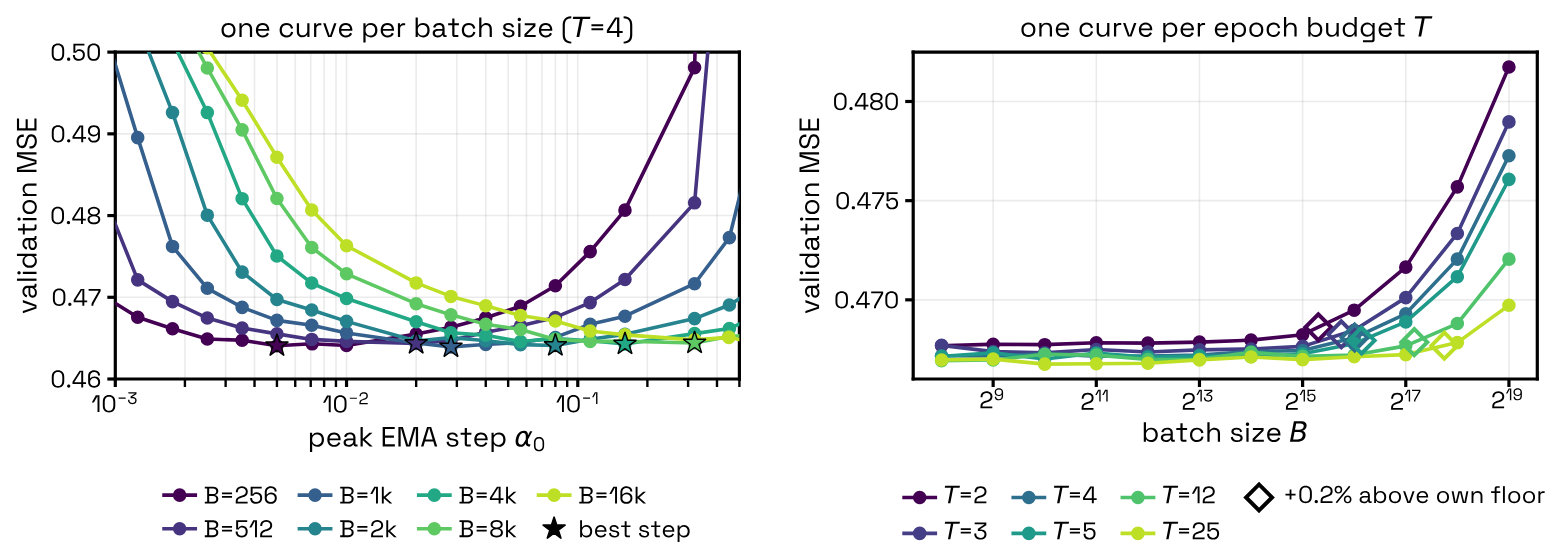
The authors fit both as power laws, linear in log space, on one dataset (DEEP):
Table 2 gives and , with rounded to a power of two. The fit used 62,410 runs for the step law and 12,219 for the batch law (Appendix B), which is the "75k runs" in the thread. On four held-out datasets (SIFT, SPACEV, arXiv, AG-News) following the step law costs a median 0.07% over the best step, and following the batch law 0.19%, close to the 0.2% knee it was fitted to.
Read the exponents as physics. means the step per point is roughly constant: double the batch, double the step. is close to . And says the batch grows almost linearly with the data, so the number of updates per epoch, , grows only slowly. That last point is what makes e-means cheap: it does not need many updates, it needs the right few.
The calculator above evaluates the formulas exactly as contrib/e_means/base.py ships them. At the paper's ablation setting (, , ) the throughput law gives and , so the whole run is 48 centroid updates with about 4 points per cluster per batch. Lloyd in the same 3 epochs makes 3 updates with about 61 points per cluster. That ratio, 16 noisy moves per pass against one exact move, is the whole mechanism in one number.
The paper states its own limits. The laws were fitted for and with , and they are tuned for high-dimensional embeddings: Section 3.3 says they are not optimal on very low-dimensional or tiny datasets, because what matters is the local intrinsic dimension, which nobody knows in advance. The paper also uses the eighth-size batch ("knee / 8" in Table 2) above two million points, where it found throughput unchanged.
Running both in two dimensions
The playground below runs my implementation of Lloyd and of e-means (Algorithm 1, with the FAISS quality law choosing and , the library's choice at ) on 1,600 points from 12 blobs of unequal size, with and both algorithms starting from the same random data points. Scrub the epoch slider, step through seeds, flip revival.
Treat it as a picture of the update rule. It is not a reproduction of the paper: is far below the fitted range, it is 2-D, and the curve is training MSE with the centroids in flight, while the paper scores held-out test MSE. On this toy, at the law picks and , 600 updates against Lloyd's 25. Over seeds 1 to 40, e-means with the last-epoch mean ends below Lloyd's 25-iteration loss on 28 seeds, and its median final loss is 0.970 of Lloyd's. It loses badly on some: seed 23 ends at 1.332 and seed 39 at 1.494 of Lloyd's. The default seed, 27, is the one closest to the median, not the prettiest. With revival off it wins on 25 seeds instead of 28. At it wins on only 10 of 40 and at on 24, which tells you the laws are being extrapolated here, as they warn.
Revival needs a caveat of its own. In none of my toy runs did a cluster end up empty, with revival on or off. In 2-D with 24 centroids nothing starves; revival here fires on clusters that are merely small and splits a bigger one. The shipped code agrees that 2-D is a bad place for it: a comment in base.py says revival lowered held-out error by 7-10% when switched off on two 2-D corpora, and the library turns it off at by default. Dead clusters are a high-, high- failure, and Table 14 is the evidence for them, not this widget.
Checking "10x fewer epochs"
The paper's headline is in the abstract: on embedding datasets e-means beats the loss of Lloyd at 25 epochs in 1.4 to 2.6 epochs. The reference is Lloyd at 25 iterations, the FAISS default, not Lloyd run to convergence. That is a fair target for practice and the paper is explicit about it.
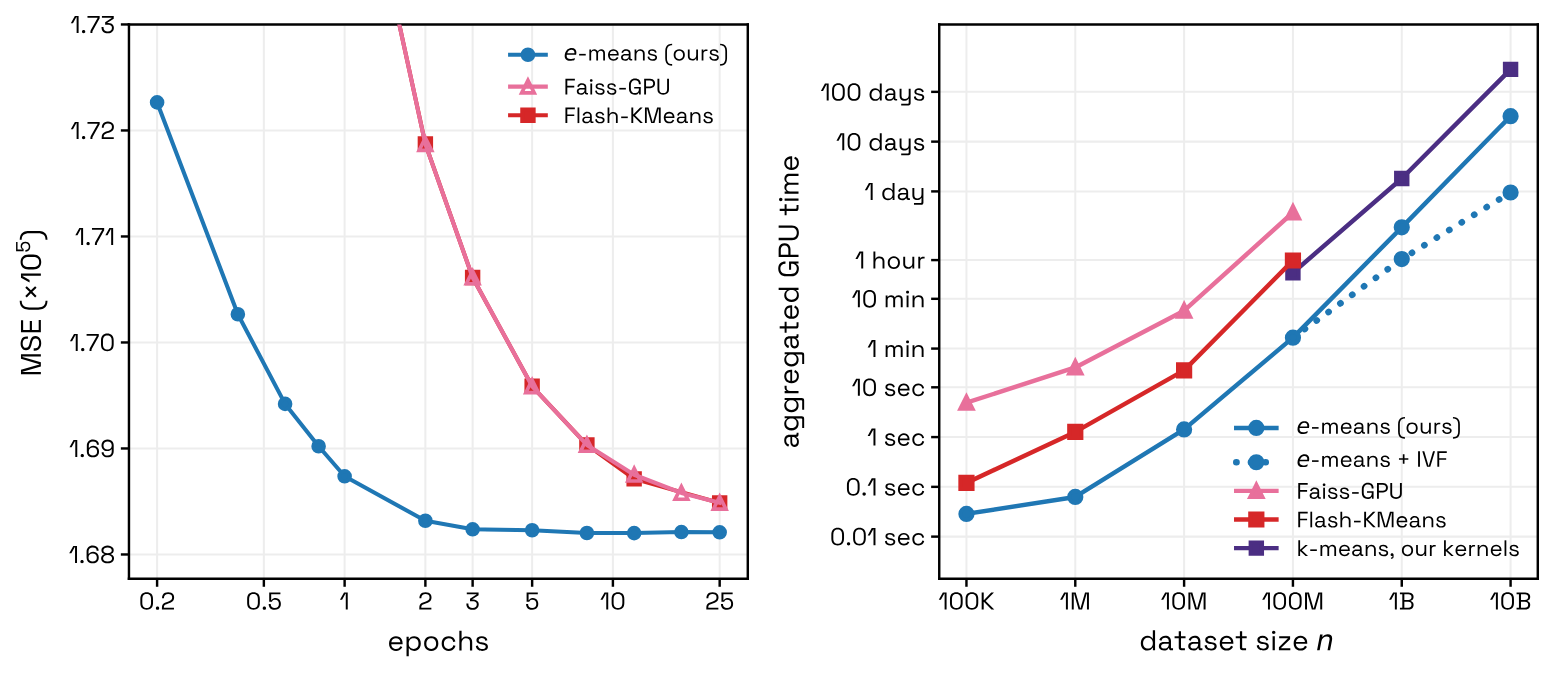
The range depends on which table you read:
| Source | Setting | Epochs to Lloyd@25 | Fewer epochs |
|---|---|---|---|
| Table 4 | 4 datasets, 1M to 1B, test, vs Flash-KMeans@25 | 1.4 to 2.6 | 9.6x to 17.9x |
| Table 11 | 11 VIBE datasets, test, vs Faiss@25 | 1.6 to 2.6 | 9.6x to 15.6x |
| Table 10 | , test | 1.0 to 3.0 | 8.3x to 25x |
| Table 10 | , train | 2.0 to 4.0 | 6.3x to 12.5x |
| Appendix D.2 | 7 synthetic distributions, median | 3.1 (dimension sweep), 2.3 (size sweep) | about 8x and 11x |
The last column is my division of 25 by the epoch count. On the main benchmarks the "10x" holds and is conservative. It gets thinner when there are many points per cluster and you care about train error: SimSearchNet++ at needs 4.0 epochs to match on train, which is 6.25x. The results map on the blog, 234 configurations over 16 datasets from 100k to 100M points, reports a median of 12.6x.
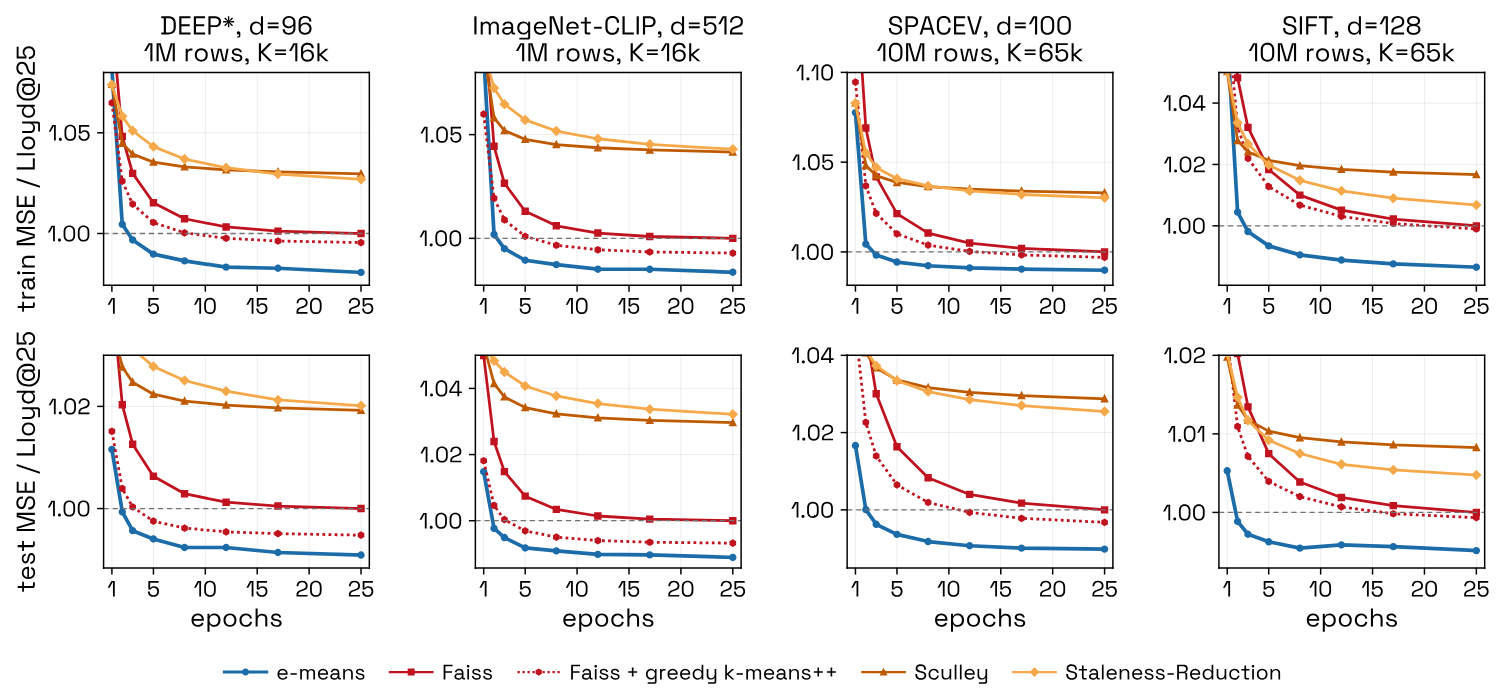
How much better is the final loss? Fractions of a percent. From Table 5, e-means after 3 epochs is 0.21% to 0.40% below Flash-KMeans at 25 iterations across the eight configurations, and after 5 epochs 0.33% to 0.83% below. Against Lloyd seeded with greedy k-means++ (the scikit-learn variant, which Appendix G.2 finds better than the original), e-means at 5 epochs is ahead on all eight by 0.06% to 0.33%, the range the paper states. At 3 epochs it is ahead on only 3 of 8. So "frequently even beating k-means++" in the abstract is true at 5 epochs and a coin flip at 3. The story of this paper is compute. The quality gain is real but small, and on a retrieval index it may not move recall much: Appendix L finds e-means reaches Flash-KMeans' converged recall faster, with similar or better recall on most VIBE datasets.
Where the wall-clock speedup comes from
Table 4 converts epochs to GPU wall-clock against Flash-KMeans: 9.5x to 45.5x. The abstract rounds that to "10-45x"; the minimum, SPACEV at one million points, is 9.5x. Divide each speedup by the epoch ratio and you get what is left after the algorithmic saving:
| Scale | Epoch ratio (range) | Wall-clock (range) | Median left over |
|---|---|---|---|
| 1M, | 10.4x to 17.9x | 9.5x to 12.9x | 0.96x |
| 10M, | 12.5x to 17.9x | 19.2x to 27.8x | 1.53x |
| 100M, | 9.6x to 17.9x | 19.9x to 35.9x | 2.04x |
| 1B, | 12.5x to 17.9x | 21.2x to 45.5x | 2.21x |
At a million points the wall-clock gain is the epoch gain, give or take. From ten million up there is an extra factor of 1.3x to 2.9x that the epoch count does not explain. The paper does not break it down. Appendix J says the CuTe assignment kernels are on par with Flash-KMeans, the precisions are comparable (e-means in BF16, Flash-KMeans in FP16), and the blog adds that 25 epochs of plain PyTorch Lloyd take 142 to 155 s at 10M against 14 to 22 s for Flash-KMeans, so the baseline is not a straw man. My guess is batching: e-means streams one large batch against all centroids, while a full-batch Lloyd also has to accumulate sums over points per pass. That is a guess. The 1B row is also a single seed on 8 GPUs, where everything else is a median of 10.
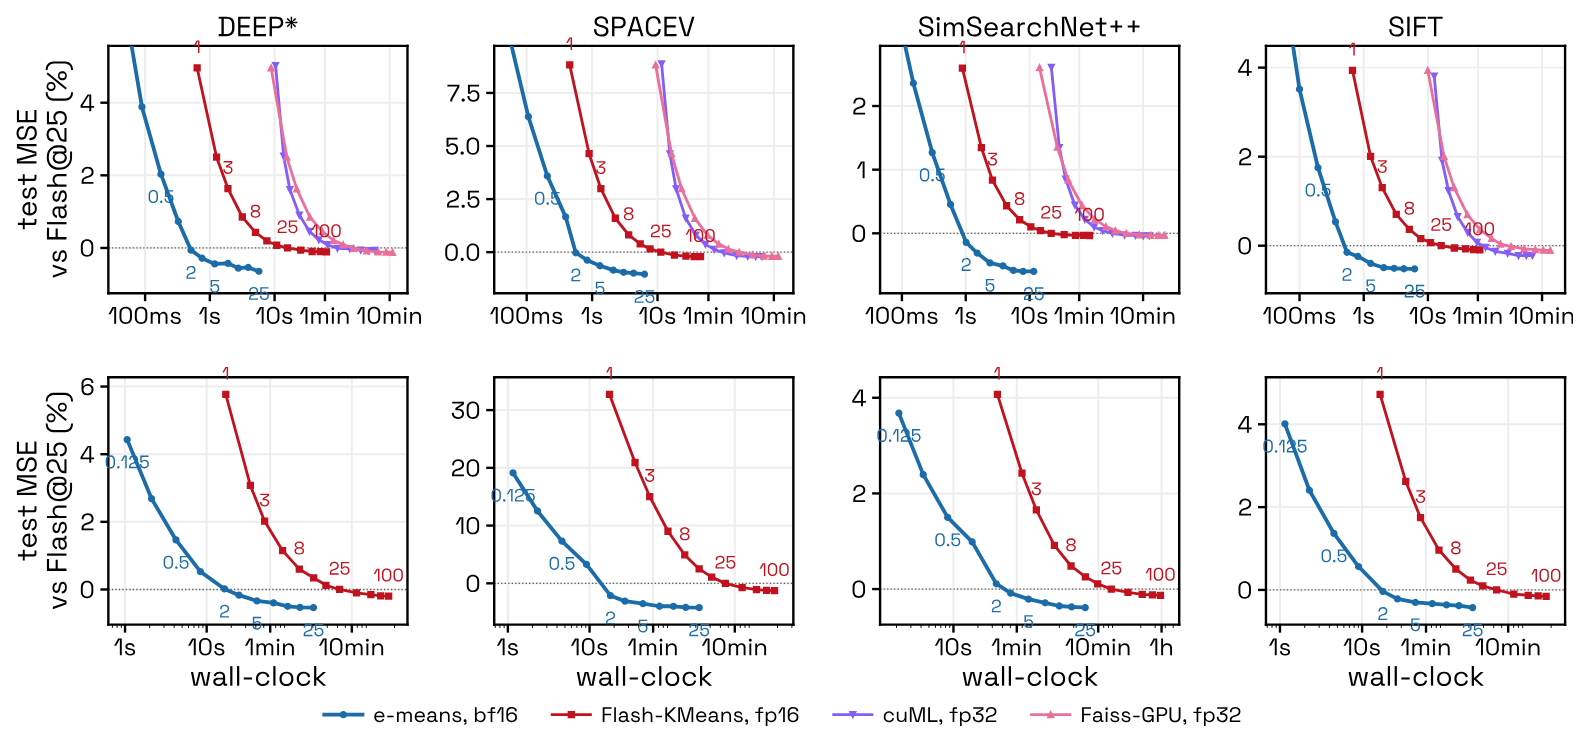
On CPU the comparison is against FAISS's own Lloyd on 64 Xeon cores: Table 11 reports 9.0x to 15.0x across the eleven VIBE datasets, and the blog says 8 to 15x. SuperKMeans, a distance-pruning method, is in the CPU plots too; pruning does not parallelise well on GPUs so it is absent there.
Billion-scale needs an index for the centroids
At (16.7 million centroids) even a fused brute-force assignment is too expensive. The paper's answer is to index the centroids with an IVF: meta-centroids bucket the centroids and each training vector only searches a few buckets. Table 3 reports GPU hours to reach Lloyd's 25-epoch loss on DINO10B subsets:
| Exact assignment | IVF assignment | ||
|---|---|---|---|
| 100M | 0.028 h | 0.030 h | |
| 1B | 4.56 h | 1.05 h | |
| 10B | 779 h | 22.8 h |
That is 4.3x at 1B and 34x at 10B, and 22.8 GPU hours for 16.7M centroids over 10 billion vectors is under one GPU-day. The approximate search makes some assignments wrong, which a Lloyd step would never tolerate; a mini-batch moving average absorbs it as more noise. DINO10B itself, ten billion 1024-dimensional DINOv3 patch embeddings, is a contribution of the paper (Appendix K) and is meant to double as an ANN benchmark.
What FAISS 1.16.0 actually ships
The FAISS changelog lists e-means under 1.16.0, dated 2026-11-09, as a run of commits: reference implementations, distributed training, BF16/FP8/INT8 assignment, Triton and CuTe backends, centroid-sharded training and IVF assignment. faiss/python/setup.py adds faiss.contrib.e_means to the installed packages. It is MIT-licensed like the rest of FAISS.
"Drop-in replacement" in the thread means a similar call, not a flag on the existing class. Nothing in faiss/python routes faiss.Kmeans or IVF training through it. You import it yourself:
import numpy as np
from faiss.contrib.e_means import NumpyEmeans

x = np.random.rand(200_000, 64).astype("float32")
em = NumpyEmeans(64, 500)            # d, k; nepochs defaults to 5
centroids, labels = em.train(x)      # labels are from the last pass
distances, assign = em.assign(x)     # exact nearest centroid, if you need it
That is the README's own quickstart; I have not run it. On GPU, Emeans takes a CUDA tensor, picks CuTe kernels on H100/H200 for BF16, Triton elsewhere on A100-class and newer cards, and plain PyTorch as a fallback. The README recommends a GPU once passes .
Reading the shipped code against the paper turned up a few differences. None changes a headline, but they matter if you try to reproduce a table:
- Default epochs. The library default is
nepochs=5, not the 1.4 to 2.6 the headline quotes. The README says 5 "is typically sufficient to beat Lloyd's loss at convergence", which is a stronger target than Lloyd@25. - Which batch law. The paper switches to the eighth-size batch above two million points. The code switches on dimension instead:
batch_law="auto"uses the quality law at and the throughput law above it, at any . - Revival in low dimension. Off at by default, on a measurement the paper does not report.
- Constants. starts at in code and in the paper; the split perturbation is in code where Appendix H says the BF16 machine epsilon; the throughput batch is capped near , where the paper says ; and is clamped to .
- Coefficients. A comment in
base.pysays the shipped fits "differ from those reported in the paper's Table 2". To Table 2's printed precision they match: 0.8244, −0.4617, 0.9003, −0.4498, −0.1057 for the step and 0.035134, 0.134749, 0.876473, 0.813344 for the batch. - Stale README.
benchs/e_means/README.mdstill says the package is "not yet in a faiss release"; the changelog andsetup.pysay otherwise.
One small trap in the API: the labels train returns come from the last pass, while the centroids were still moving. They are not always each point's nearest final centroid. The README says this plainly and argues that spending your FLOPs on another epoch beats re-assigning.
Where I land
I think this is the rare paper that changes a default. The mechanism is not exotic, and that is in its favour. Every piece is something deep learning already trusts: an EMA instead of a running mean, a cosine on the step, a fitted rule for batch size, a split for dead codes. Lloyd is one corner of the family, and the paper has the sweep to show that corner is a bad place to sit. The 10x in epochs survives the tables on the embedding benchmarks it was built for, and it degrades in the expected place (many points per cluster, train error) rather than collapsing.
What I would not repeat from the thread is the quality story. The loss gain over Lloyd at 25 iterations is a few tenths of a percent, and against a well-seeded Lloyd it needs 5 epochs to be consistent. If your k-means is already cheap, e-means buys you little. If it is an IVF build over hundreds of millions of vectors, or a codebook you retrain every week, the compute saving is the whole point and it looks real. I would switch on embedding data with in the hundreds and above a million, keep nepochs=5 until I had measured my own crossing point, and leave Lloyd in place for low-dimensional geometry, where the laws were never fitted and the library itself switches revival off. The paper's most useful artefact may end up being the laws, because they are what made a mini-batch method usable without a sweep. Anyone who has tuned MiniBatchKMeans by hand knows that was the actual blocker.
For the record of what is mine: the playground numbers, the Lloyd-equivalence check, the recipe evaluations and the two division tables above are my own computations, from my TypeScript port and from the paper's tables. Every other figure is the paper's, the blog's or the README's, and I have not reproduced any of their benchmarks.